

Photo by Nubelson Fernandes on Unsplash
How To Effectively Debug CSS
Time-saving hacks for debugging CSS


Introduction
Debugging code is one of the non-negotiables in programming. For front-end web developers, debugging Cascading Style Sheets (CSS) comes as a hassle because of its complexities; for example, there are many ways to achieve the same thing. This guide is prepared to demonstrate stress-free and time-saving ways to debug CSS.
Prerequisite
To get a good grasp of the tips that are shared here, it is important to have a working knowledge of HTML and CSS.
Brief CSS Overview
Cascading Style Sheets are the style tool or language of modern websites. CSS is used to achieve basic typography like font size, font color, and font style. It is also used for formatting and changing the layout of text, images, and other elements on a webpage. CSS is also employed to add animations to a page, enhance accessibility, and achieve responsive web pages across several devices. Together with Hyper Text Markup Language (HTML), CSS forms part of the bedrock of any modern and functional website.
The most basic form of CSS is called vanilla CSS, which essentially means CSS in its native form without frameworks. Most developers nowadays, however, use various CSS frameworks like Bootstrap, Tailwind CSS, Bulma, Semantic UI, and Materialize, to mention but a few. Using CSS frameworks has its pros and cons, but this is not the focus of this guide.
In sum, it is impossible to have a modern website without incorporating CSS, either in its pure form or with frameworks. This article focuses on vanilla CSS.
Meaning and Importance of Debugging
Debugging is the process of finding and eliminating errors or bugs in a software program. Bugs may be likely or exist in the program. Bugs are a normal part of every computer program. The process of debugging a program involves identifying the error, isolating the error, and deploying fixes to eliminate the bug. In many cases, software programmers and engineers use debugging tools to simplify the process.
Debugging is important in software development because it helps to remove issues that occur in the use of a software program, making it perform in an unexpected manner or even crash. Also, it reduces or even eliminates user dissatisfaction with the software.
You should note that debugging is different from testing. The goal of testing is to spot or identify bugs, and the purpose of debugging is to get rid of the bugs.
Debugging CSS
Now that we have seen what debugging entails, it is important to know that, unlike traditional programming languages like JavaScript, Python, Rust, Go, etc., CSS is not a programming language. It is a styling system. Therefore, when reviewing CSS ‘code’, some rules of debugging will ostensibly fail. Some people have jokingly called CSS “Crazy Style Sheets” because of its peculiarities.

Challenges of Debugging CSS
As mentioned earlier, debugging CSS is challenging. Some reasons for this are linked to the fact that it is not a programming language. Therefore, no error messages will be received. Unlike regular programming languages that give a hint of the kind of error, whether syntax error, reference error, indentation error, range error, or type error, CSS throws up no errors. What usually happens is that the style applied does not work. This particular issue is unnerving, and it can leave you wondering where you went wrong.
Another challenge is the fact that there are different ways of doing the same thing with CSS. For example, if you want to center a div, you can use flexbox, absolute positioning, set the margin property to 0 auto or any of the other ways listed in this blog post. One disadvantage of this is that one method may work in a project but will not work in a more complex project where the elements interact differently.
When working with CSS, elements interact closely and, sometimes, overlap. In cases where the elements overlap, changes to the styling of one element can significantly affect the behavior of others. If you have not anticipated the output, it can make you scramble for solutions on how to fix the problem, coupled with the fact that no error message will be generated.
One major challenge with CSS debugging is that different browsers have different ways of rendering web pages. In many cases, elements may render properly on Chrome, for instance, but not in the same way on Firefox or Safari.
Prerequisites for Debugging CSS
Now that you have seen the challenges with CSS, there are certain knowledge prerequisites for debugging it. This is to help you locate the bug quicker.
The first is that you should have a good grasp of the box model. In CSS, the box model simply means that every element is wrapped in a box. Each box comprises the border, margin, padding, and content. Understanding the box model is a sine qua non to effectively debugging CSS because it will help you know how the elements are positioned and when an element is rendering differently from what is expected, like an overflow.
The next prerequisite is understanding CSS specificity. CSS specificity is a score that decides the particular style that will be applied to an element. In a nutshell, inline styles rank the highest, followed by IDs, then classes, pseudo-classes, and attributes, and lastly elements and pseudo-elements. You should note, however, that the!important rule overrides every other style declaration, including inline styles. You can read more on CSS specificity here.
Another important thing you should note before attempting to debug CSS is the user agent stylesheet. Simply put, a user agent stylesheet is a browser-specific default stylesheet applied to all web pages. You may find, in some instances, that your styles behave differently than what you expect, and this may not be unconnected with the user agent stylesheet. The good news is that you can override these default styles by using normalize.css, a CSS reset, or by overriding the default styles. To locate the user agent stylesheet, go to your browser’s developer tools and navigate to styles.
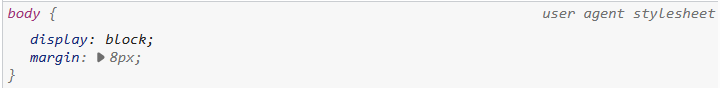
📷: User agent stylesheet on Edge browser for the body element.
Ways of Debugging CSS
With the above prerequisites in mind, we will now discuss different ways of debugging CSS.
The Famous “Border: 1px solid red” Method
Many developers swear by this method of debugging CSS.

This method has also been dubbed the console.log of CSS. For starters, console.log is a popular way of debugging JavaScript code, similar to the print() method in Python.

This method involves selecting all the elements using the (*) selector and declaring a border property as shown below:
* {
border: 1px solid red;
}
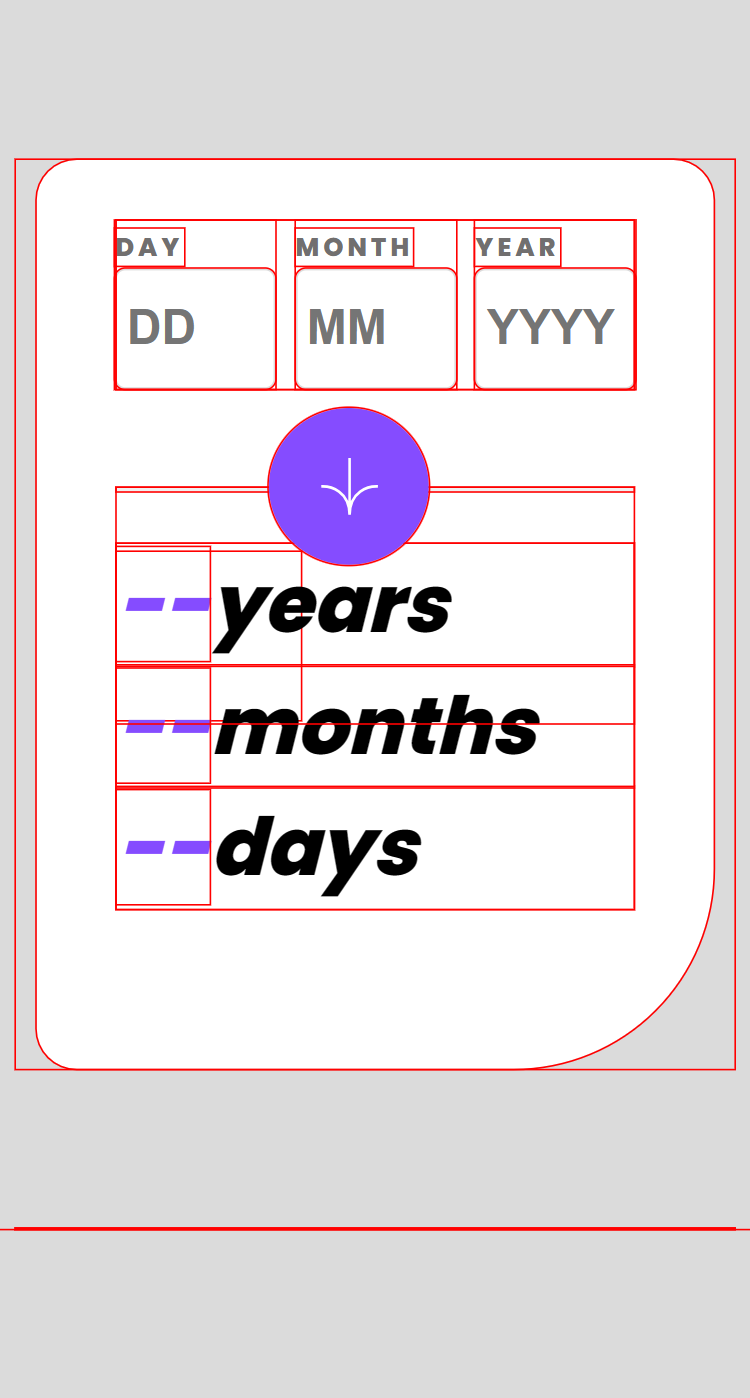
This gives the elements a red border, as shown below:
No doubt, one advantage is that the red border given to each element shows you the full width and height of the element and is particularly useful for dealing with unnecessary horizontal and vertical scrollbars.
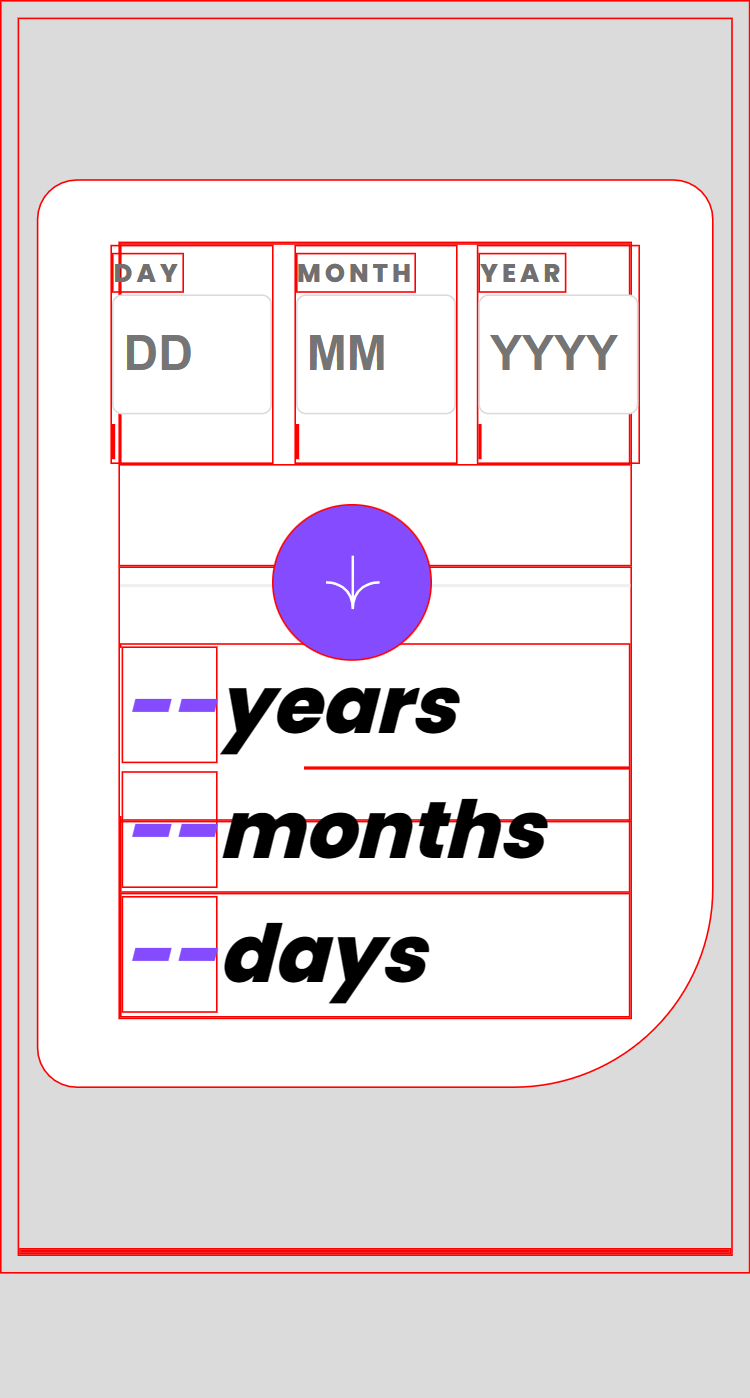
In this article, however, it is suggested that the outline property be used instead of the border property. This is because, unlike the border property, the outline property will not increase the DOM size of the element. The code is similar; you will just use the outline property instead of the border property.
* {
outline: 1px solid red;
}
Here is a practical illustration:
When you compare the two images, you can see that the outline property is more detailed and focuses on the individual elements, unlike the border property. It is particularly useful for dealing with overflow issues.
Browser’s Developer Tools
The main tool for debugging CSS is your browser’s developer tools. The developer tools are great for debugging CSS, even without using extensions. To debug CSS using this method, navigate to your browser’s developer tools. There are different ways of accessing your browser’s developer tools. The first option is to right-click on the web page and select Inspect from the drop-down menu. You can also use F12 or Ctrl + Shift + I for Windows and Command + Shift + I on macOS.
You can use the developer tools to inspect elements, check for responsiveness across various devices, and even make direct styling changes.
The styles tab in the developer tools is useful for inspecting elements to see which styles apply to them, including the user agent stylesheet.

You can also make changes right here, add more styles, and see them in action directly. You should note, however, that whatever changes you make to the developer tools will not be incorporated into your local code. You will have to manually add the changes.
As stated earlier, if you are encountering issues with the page's responsiveness, you can use the tools on the left-hand side of the developer tools to toggle between different device widths. You can also view the page’s media queries and much more.

To learn more about debugging using your browser’s developer tools, check out this video by Kevin Powell.
Browser Extensions
The final method of debugging CSS that we will be discussing in this article is browser extensions. The most popular extension is the Pesticide extension. You can get it for your Chrome or Edge browser here and for your Firefox browser here.
To use the extension, just install it on your browser and toggle it when you are on the web page whose CSS you want to debug. The Pesticide extension works like the outline method that we saw earlier.
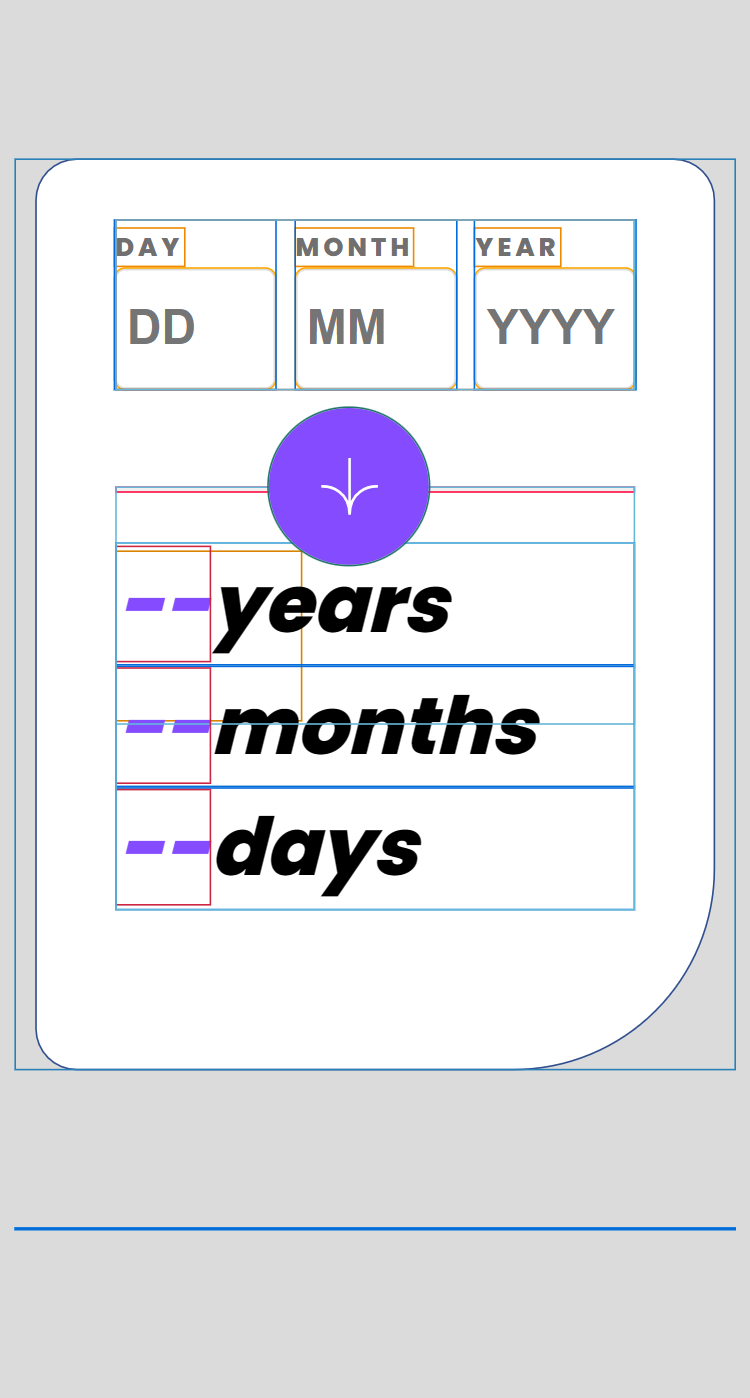
When you inspect the elements, you will see that the extension forcefully adds an outline property to them. Let us take a look at the image below:

One advantage of using this extension is that it saves you time looking for specific elements since all of the elements are outlined.
Another extension that works like the Pesticide extension is Debug CSS.
Conclusion
In this guide, we discussed the importance of debugging in software development as well as the differences between debugging programming languages and CSS. We also examined various time-saving methods and tools for debugging CSS.
Enjoy your CSS debugging!